In our new preprint (Ruaud et al., 2022), we introduce endoR: an R-package to interpret machine learning models. We also present the application of endoR to human gut metagenomes to identify associations between H2 producers and methanogens in the human gut.
Read the full preprint: Albane Ruaud, Niklas A Pfister, Ruth E Ley, Nicholas D Youngblut. Interpreting tree ensemble machine learning models with endoR. bioRxiv (2022). https://www.biorxiv.org/content/10.1101/2022.01.03.474763v1
Take a try at endoR: https://github.com/leylabmpi/endoR
Back in 2020, Albane got frustrated seeing that (i) different variable importances from her random forest (RF) models were discordant, (ii) getting information from models on variable interactions was very limited for large datasets such as hers. Hence, she decided to create endoR to gain more information from RF and boosted trees models, the method is thus compatible with both classification and regression problems and any type of features. endoR was inspired from existing work: the rule ensemble theory (Friedman and Popescu, 2008) and SHAP values (Lundberg, 2017); Niklas Pfister helped her develop the method. It goes as follow:
1) Simplify the tree ensemble model into a decision ensemble. A decision = a rule on predictive variables + a prediction.
2) Regularize the decision ensemble: discretize numeric variables (this simplifies decisions and ease interpretation), prune decisions = remove unimportant variables, bootstrap and perform stability selection = select important decisions.
3) Measure for each single and pairs of variables from each decision: the importance = gain in accuracy due to the (pair of) variable(s) and the influence = change in predicted value due to the (pair of) variable(s). Summarise across all decisions for each single and pairs of variables.
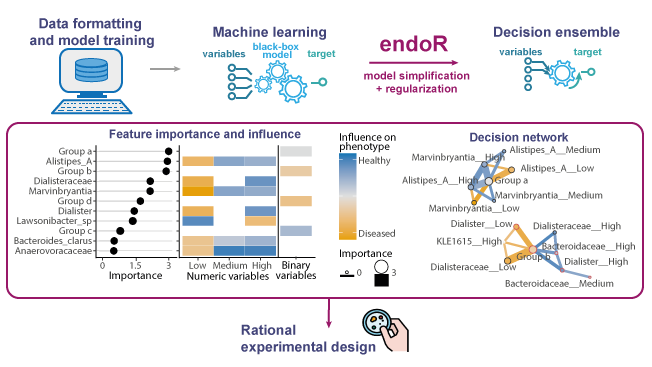
4) Visualize: the 1st plot shows the variable importance and influence; the 2nd plot is a decision network: nodes = variable, edges = interaction effects between variables, color = influence, size/width = importance. For instance on the attached figure, samples in “Group a” are more likely to be healthy if they have high relative abundances of Alistipes A and Marvinbrytia (this is a fake example based on simulations).
Albane validated endoR on fully simulated data and real metagenomes with a simulated response variable (this simulated response can be thought as an artificial phenotype). She also showed that it is as accurate as existing methods, but more informative and easier to interpret.
Finally, Albane and Nick interpreted RF models predicting the presence of methanogens in 2203 human gut metagenomes with endoR and genomic characterization. They showed that methanogens co-occur with a network of H2-producers (e.g., Christensenellales), H2-consumers (e.g., Clostridiaceae), and slow growers (Oscillospirales). Their results provide new insights into the ecology of methanogens in human guts and show that their associations with host phenotypes (e.g., BMI) may be specific to populations and thus due to indirect relationships.